
Executive Summary
The spending patterns that characterize how we service and customize our homes represent a distinct and valuable area of the economy. Our homes are typically our biggest purchases, our most valuable assets, and our largest source of savings. At the same time, homes are deeply intimate places in a non-economic sense. They’re where we spend most of our time — where we grow our families, raise kids, age, retire, study and recreate.
Home improvement continues to be a buzzworthy topic – especially with dominance of home improvement-focused TV shows, the benefit of choosing renovation over relocation, and the fluctuating pros and cons of renovating in a high-dollar real estate market. But when it comes down to brass tacks, homeowners find it’s not all about aesthetics: They must address the necessities too.
In this year’s State of Home Spending report, HomeAdvisor’s research team took a deep dive into how we prioritize our savings, our spending and our preference for rooms, as well as how we value having a defined sense of place for ourselves and for our families. Methodology
The home services market is a dynamic economic engine that employs millions of service professionals in stable, well-paying jobs while delivering joy and satisfaction to tens of millions of consumers. HomeAdvisor’s State of Home Spending helps us understand how this engine continues to develop and change based on the ongoing evolution of consumer tastes, sentiments and behaviors.
Key Findings
2018 was a robust year for consumer spending on home services, with average total spending of $9,081 across all home service categories.
- Consumer spending on home improvement has risen 17% in the last 12 months.
- Homeowners are spending more on home improvement projects than home maintenance projects. For every $1 spent on home maintenance, homeowners are spending an average of $5 on home improvements.
- Over the past year, room remodels have been the most popular home improvement project, with bathrooms topping the list for the second year in a row. Looking forward, homeowners are prioritizing new appliances, roof replacements and hardwood refinishing in addition to room remodels.
- Homeowners list replacing or repairing damage, defects and decay as the number one reason for spending on home improvement projects.
- Motivations differ among generations: Millennials are more likely than other generations to complete home projects for increased home value. Baby boomers and Generation X are motivated to “modernize” their homes while millennials and the silent generation are motivated to “improve aesthetics and design.”
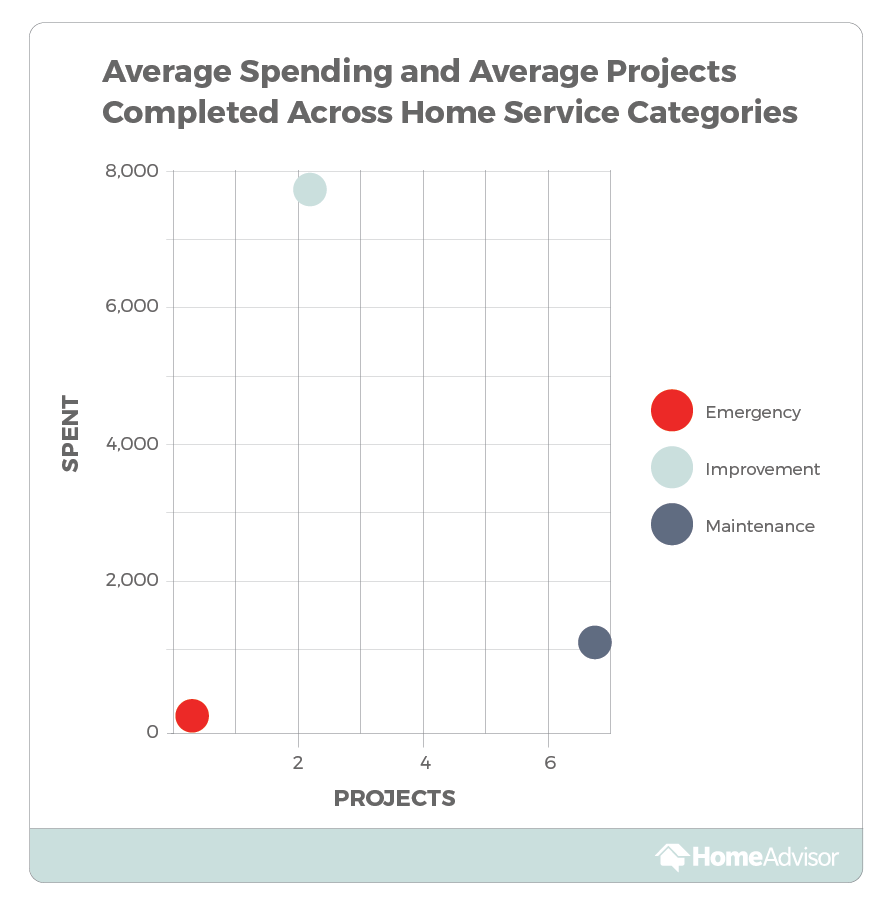
- While homeowners are spending more on home improvement than home maintenance, they report completing an average of 6.7 home maintenance projects over the past 12 months compared to 2.2 home improvement projects.
- One in three homeowners reports having to complete an emergency home project, with the average cost falling around $1,206. However, two out of three homeowners report having no emergency projects. Homeowners living in areas prone to extreme weather events report the highest spending.
- Older homes don’t necessarily require higher emergency spending. In fact, homeowners report spending $3.70 less for every year since a home was built, meaning that the owner of a 100-year-old home could spend an average of $370 less on emergency home projects per year than the owner of a brand-new home.
Part 1: Spending on Home Services
Our research looks at spending on home services across three broad categories: home improvement spending
(things like renovating a bathroom or kitchen), home
maintenance spending (think of clearing gutters, tuning an HVAC system and seasonal landscaping) and home
emergency spending (such as fixing a broken hot water heater or repairing hail damage to your roof).
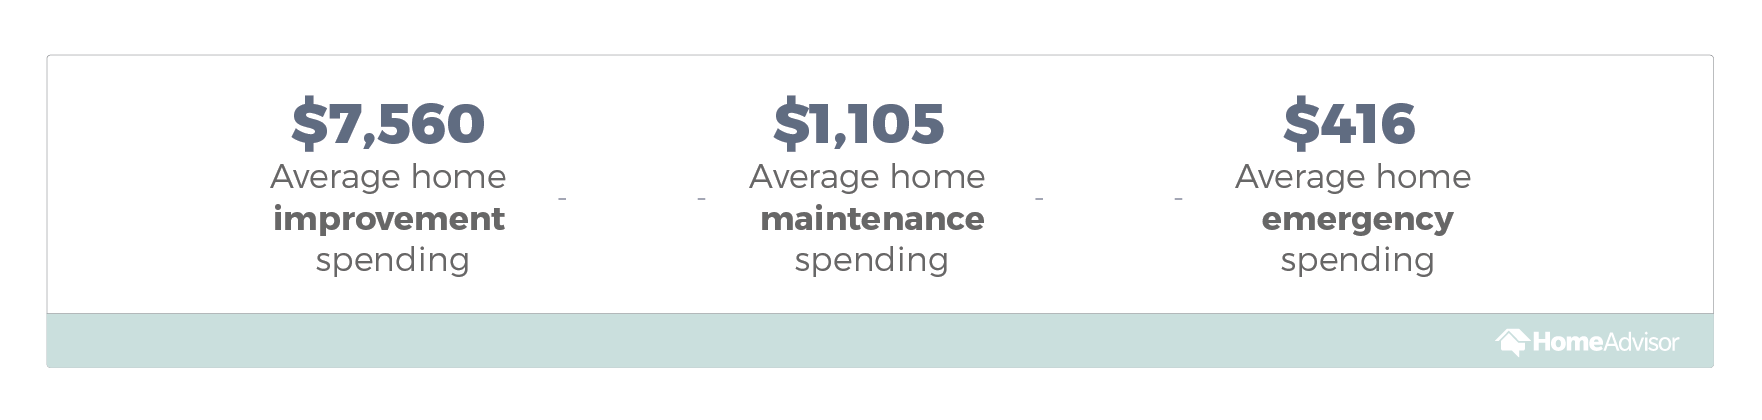
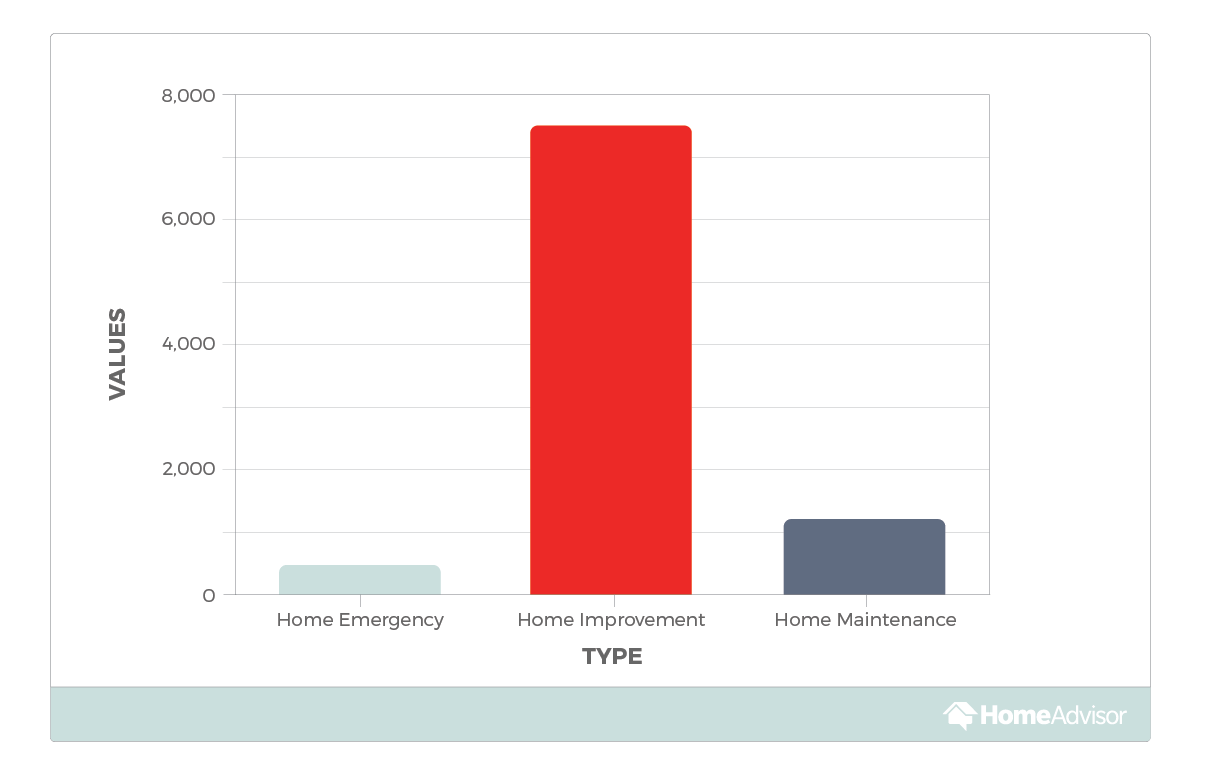
2018 was a robust year for overall consumer spending on home services, with average home improvement spending at $7,560, average home maintenance spending at $1,105, and average home emergency spending at $416 — for an overall total average spending of $9,081 across all categories.
1.1 Home Improvement Spending & Projects Completed
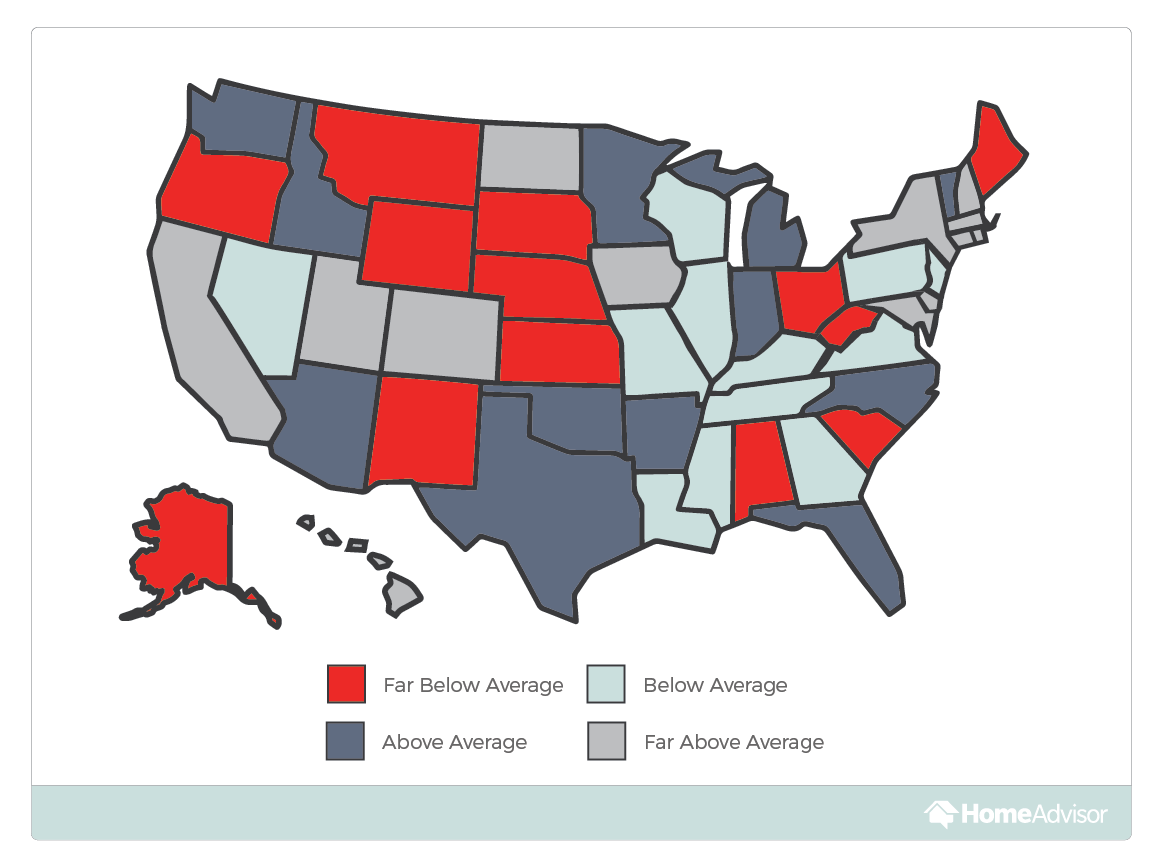
Home improvement spending across all consumers in 2018 averaged $7,560. However, spending differs dramatically from state to state, with high cost of living states like Massachusetts, Hawaii, Rhode Island and Maryland among the top five, and lower cost of living states like West Virginia, Wyoming, New Mexico, South Dakota and Maine in the bottom five.
The average number of home improvement projects
completed in the last 12 months was 2.2; however, a few homeowners in our sample did not complete any projects and two completed more than 25.
Spending per household is up
17.15% from 2018
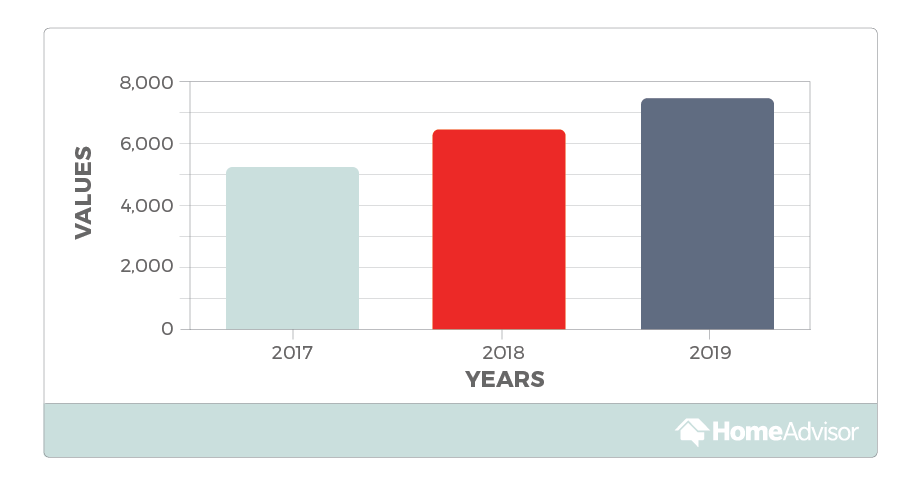
Nationwide, spending per household is up 17% from 2018, according to HomeAdvisor data. Likely contributing to the ongoing increase in per-household spending are factors such as the increased rate of wage growth for consumers, the growing cost of skilled trade labor, the cultural focus on design aesthetics and quality of life, and newer and better home improvement tools.
1.2 Home Maintenance Spending & Projects Completed

For every $1 spent on home maintenance, home owners are spending an average of about $5 on home improvement.
Home maintenance is a critical part of homeownership. Our 2019 State of Home Spending Report marks the first time we’ve studied consumer behavior for home maintenance at the same time we’ve looked at home improvement and home emergency spending.
In the last 12 months, homeowners spent an average of $1,105 on home maintenance projects, completing an average of 6.7 home maintenance projects per year.
Every homeowner must strike the balance between spending on home improvement and spending on home maintenance to prevent costlier repairs in the future. For the average homeowner in our study, this balance was struck with a ratio of about 5 to 1. In other words, for every $1 spent on home maintenance, homeowners are spending an average of about $5 on home improvement.
The large gap between the two perfectly captures the reality that, even though it’s important, we do not prioritize home maintenance. Instead, we favor big-ticket projects like kitchen and bathroom remodels.
1.3 Home Emergency Spending
The average home emergency spend is a relatively manageable $416; however, that is lowered significantly by the people fortunate enough to have no home emergencies. Consumers who did have an emergency paid an average cost three times higher, at $1,206. This means that while there is a less than 50% chance a homeowner will suffer a home emergency in a given year, the average cost to address an emergency will be much greater for those who do.
Home emergency spending, just like home improvement spending, varies dramatically by state. However, unlike home improvement spending, which is largely guided by average cost of living, home emergency spending is largely guided by weather events such as tropical storms, intense thunderstorms, flooding and damaging hail — with states like Texas, Alabama, Georgia and Louisiana leading in spending.
Perhaps counterintuitively, higher home age does not predict higher emergency spending. In fact, the opposite is true. Looking at home age alone — with no other variables — a homeowner will spend an average of $3.70 less in emergency spending per year for every year their home was built. For example, the owner of a 100-year-old house will spend, on average, about $370 less per year on emergency spending than the owner of a brand-new house. (A multivariable prediction of the factors that predict total home spending is included in Part 2 of this report.)
1.4 Top Home Improvement Projects
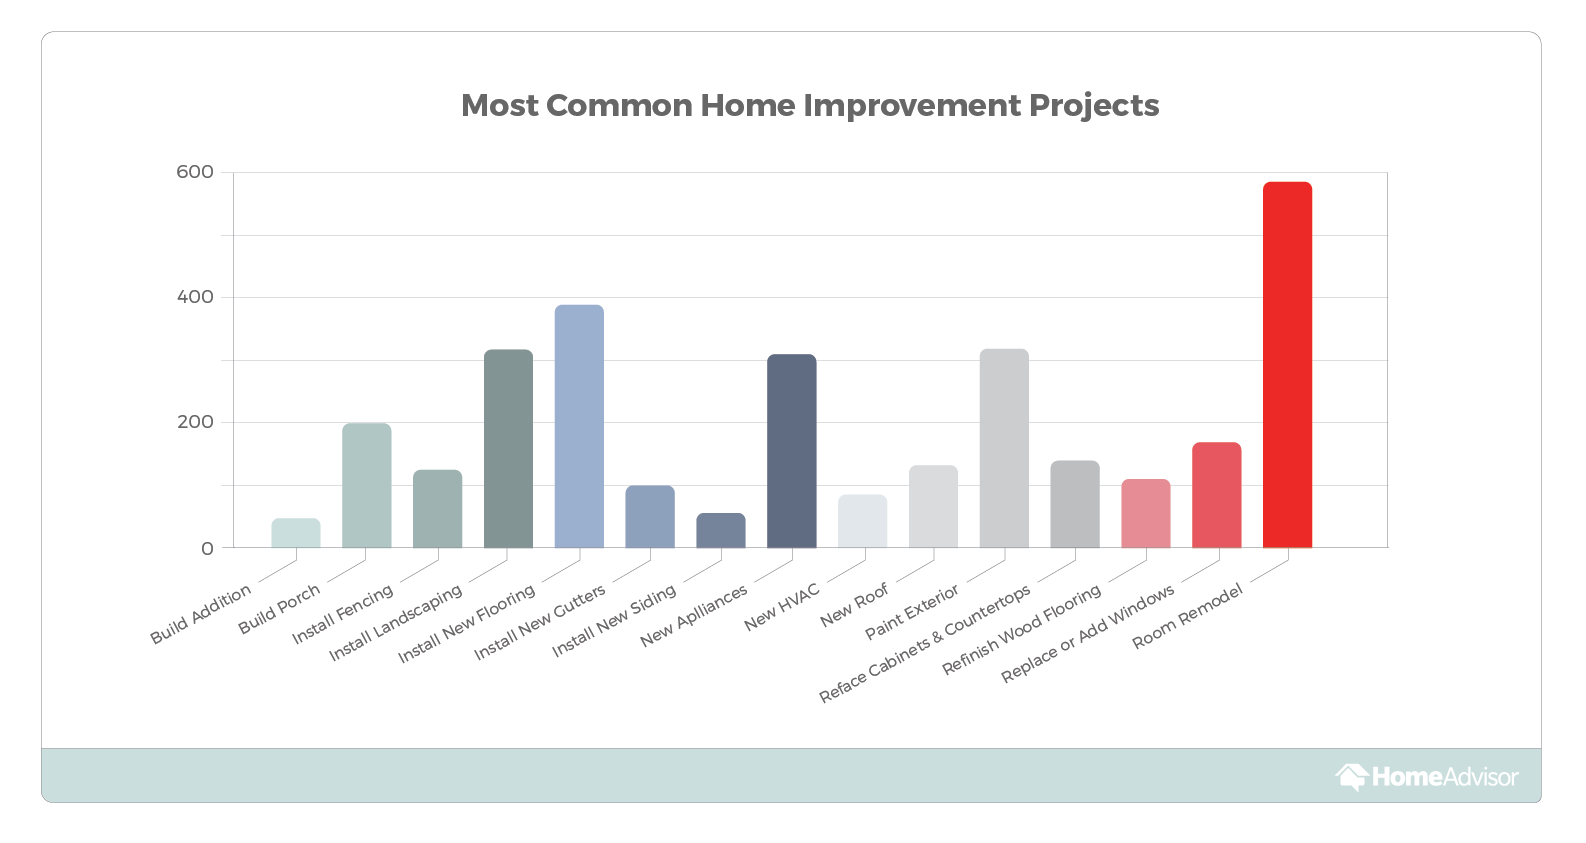
Room remodels remain the most popular home improvement project, followed closely by new flooring, landscaping, exterior painting and new appliances. Among room remodels, bathrooms remain a popular choice. Other top choices — such as landscaping, flooring, and exterior painting or veneers — offer homeowners relatively affordable ways to add value and curb appeal to their homes.
Cost estimates for the most popular home improvement projects are available in our True Cost Guide:
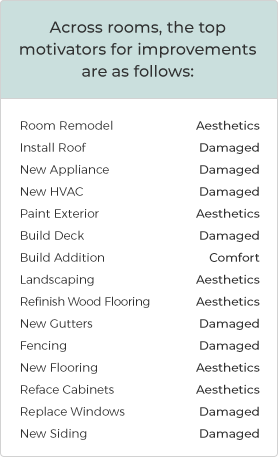
1.5 Reasons for Overall Home Improvement
Reasons for investing in home improvements vary. We asked respondents to pick from a list of primary reasons for their home improvement and remodeling projects, with options ranging from improving comfort and family happiness to preparing a home for sale. Overall, the number one reason people listed for home improvement spending was to replace or repair a problem; second was to improve the overall aesthetic of their home. In no case did a respondent list family or personal comfort and happiness as their chief reason for tackling home improvements.
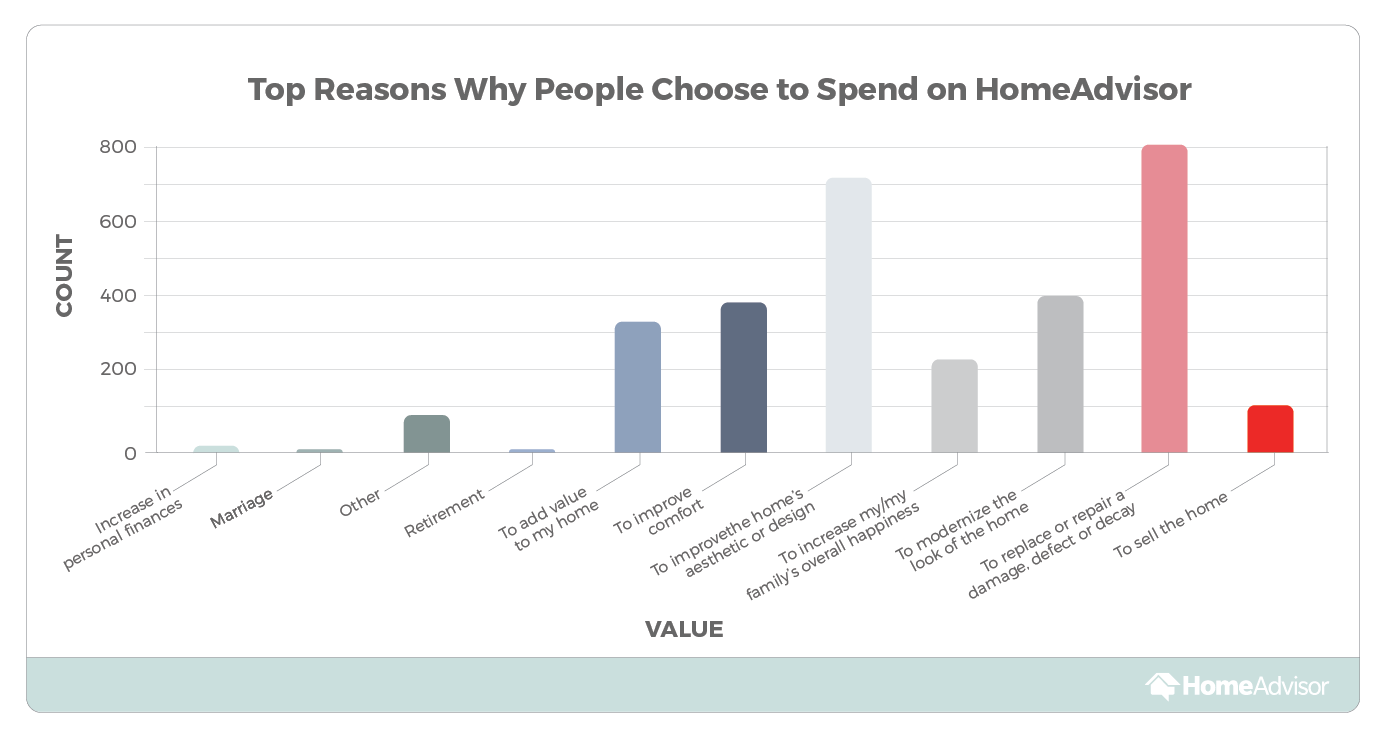
What is striking about these findings is that the amount of home projects in which damage is the motivator suggests that homeowners are neither prioritizing annual home maintenance nor distinguishing between home improvement and home maintenance.
1.6 Most Planned Projects For Next Year
The motivations behind home project spending are clear, which is why we can expect little to change across the board in the coming year — though per-project spending could increase as incomes and material and labor costs continue rise.
We expect new exteriors and hardwood floor refinishing to increase in popularity. Homeowners are also suggesting that they’ll be doing more room remodels, installing new appliances and updating HVAC systems and roofs. Interestingly, no respondents reported plans to replace their gutters within the next year, while many have tackled the project within the past 12 months. This is further symptomatic of the fact that homeowners tend to find home maintenance projects like gutter replacements less exciting to plan for than other renovations.
The home improvements homeowners plan to spend their money on versus the improvements they’ll actually hire a handyman to do can change dramatically as new needs arise.
Part 2: Home Characteristics
Respondents’ home ages varied dramatically, averaging 38 years old. While some homes were brand new, a small group of homes were constructed prior to 1930.
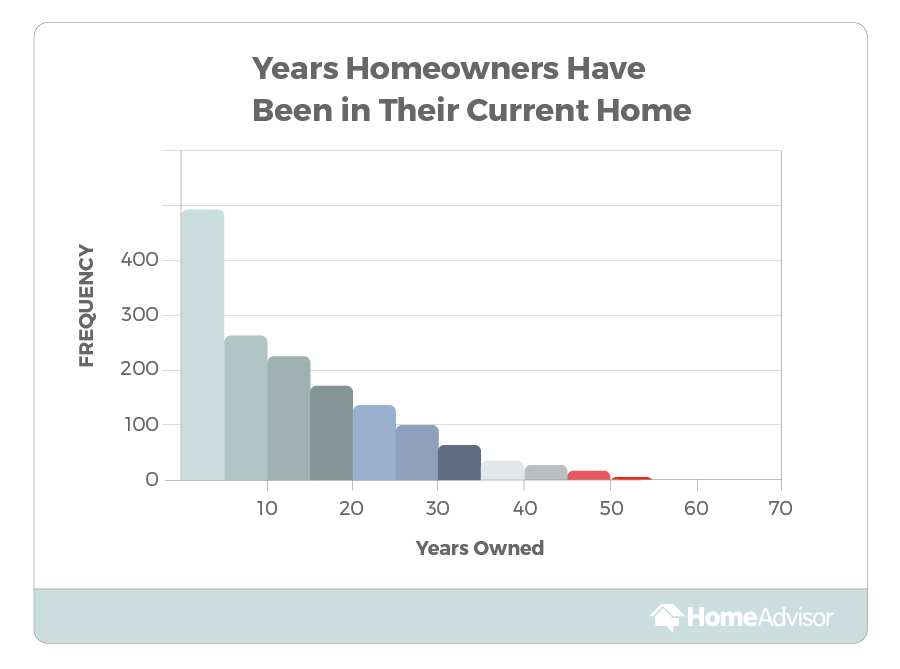
On average, homeowners have owned homes for 14 years, and 45 percent of respondents report that they are living in the first home they ever purchased.
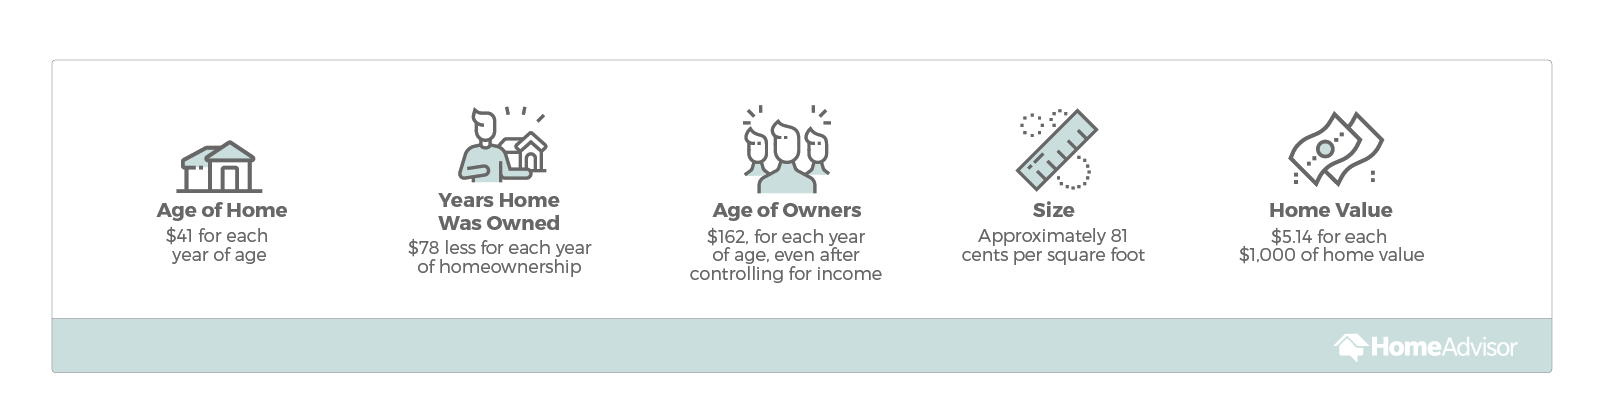
2.1 Home Characteristics that Predict Total Spending
After examining a number of home characteristics, including the income of the owner, the number of projects completed and other factors, we found that the following predicted overall expenditures on home services with a high degree of statistical significance after controlling for each of the included variables:
Part 3: Demographic & Geographic Differences
Our research uncovered some interesting generational and gender differences. Some of these differences are unsurprising, and some are quite novel. All of them will help to shape a deeper understanding about how attributes across incomes, genders and age groups impact the overall home services market.
Of course, it is important to qualify that all forms of statistical differences across group central tendencies are just that: differences across central tendencies. These broad group differences don’t necessarily predict what any individual will do.
3.1 Behavioral Differences Between Genders
Men are nearly 50 percent more likely to call themselves the ‘sole’ decision maker. Just 43% of women surveyed say they’re the ‘sole’ decision maker versus 67% of men.
Women report completing an average of 9% more home improvement projects than men and a median spend about 7% higher than men; however, men have reported spending an average of 17% more than women. In other words, women consistently spend the average, while men tend to be cheaper overall. But when men do decide to make significant home expenditures, they are more extreme.
3.2 Generational Differences
While our sample sizes for Generation Z and the GI generation are too small to make any sound inferences, we do capture very important trends from the remaining four generations: millennials, Generation X, baby boomers and the silent generation.
Reasons for home improvement ranged across generations, with a peculiar trend of millennials emulating their grandparents’ preferences for home improvements favoring aesthetics and design, with Boomers and Generation X favoring modernization over aesthetics.
This likely reflects the trending design aesthetic of the millennial homeowner — a combination of mid-century modern and older design styles. Millennials are simply less likely to consider their design aesthetic essentially modern.
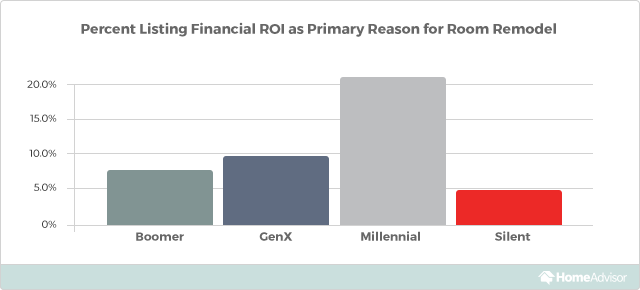
Of course, that’s not to say that millennials eschew all things modern. In fact, they’re more than twice as likely as Generation X to list adding to their home’s value as an important motivator for home improvement projects, and about three to four times as likely relative to baby boomers and the silent generation. This is likely due to a combination of typical youthful focus on wealth accumulation and millennials’ comparatively poorer financial situation driving a hunger to recover relative to their older cohorts.
The generational gap in priorities is a dramatic example of the millennials’ current struggle to catch up financially with older generations. Even 10 years after the great recession, the generation that came of age during the collapse and slow recovery is trying hard to get its feet back on the ground.
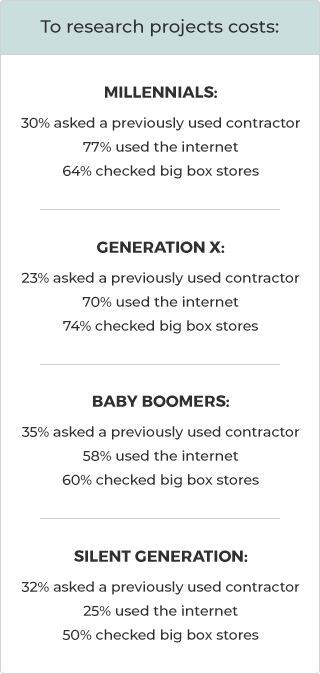
Millennials’ need for financial growth is manifesting itself not only in intergenerational differences in spending priorities, but also in methods of price and cost searching. Respondents report generational differences in their methods for researching home improvement costs, with Generation X and millennials preferring online and retail options. Baby boomers and the silent generation also used the internet, but they relied on previous contractors and retail options more evenly.
These trends make sense: Millennials are consistently using multiple methods to research the costs at a higher level than other generations. In addition to wanting a higher return on their investments, millennials are price-sensitive consumers that have come into their adult lives in the midst of the great recession. They haven’t yet hit their peak earning power and have smaller houses than any other generational cohort (1% smaller than baby boomers, 5% smaller than the silent generation, and 6% smaller than Generation X).
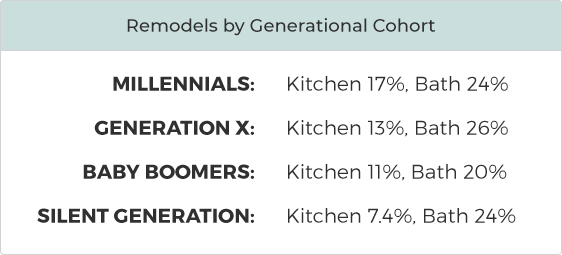
Among remodeling projects, bathrooms overwhelmingly remain the most popular choice across all generations. This is likely because they are relatively cheap compared with other room renovations. Remarkably, the preference gap between kitchens and bathrooms grows larger as people get older — with the proportional gap being smallest among millennials and largest among the silent generation.
This is probably attributable to the dominance of the kitchen as the entertainment hub of the home, a resurgence of interest in cooking among millennials thanks to social media, the generation’s interest in health, and the millennial need for a high return on investment. Minor kitchen remodels provide a better ROI than any bathroom remodel.
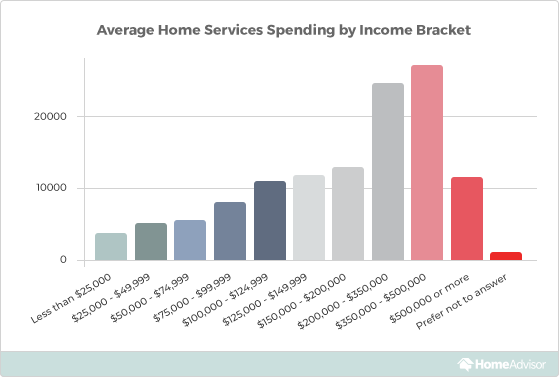
3.3 How Does Spending Change with Income?
Interestingly, our research finds that homeowners have more savings readily available than the average American. The Wall Street Journal recently reported that one quarter of working adults have no retirement savings whatsoever, 42% of workers aged 18-29 have nothing set aside whatsoever, and 40% of working adults would have a hard time affording a $400 emergency.
In contrast, 87% of our survey’s respondents report having $1,000 available for an emergency repair. This is probably due to a confluence of factors, the most important of which being that homes are a great form of ‘forced’ savings that encourage us to build equity. Also, buying and maintaining a home encourages a certain degree of responsibility and planning.
There is, of course, also a selection mechanism at play. This shows that those of higher means are better able to be homeowners; however, the recently reported numbers are higher than one might expect due to income factors alone.
Homes are a great form of ‘forced’ savings that encourages all of us to build equity.
3.4 Affirming Similarities Across Political Identification in Our Hyper Partisan Era
In our polarized and partisan era, it’s easy to find differences across political groups. This year, we decided to take a different approach to our research and examine similarities.
- 37% of Republicans have children under the age of 18 in their households, only slightly more than the 33% of Democrats.
- 5.93% of Democrats are expecting their household to grow in size in the coming year, relative to 5.92% of Republicans.
- The respective average home value for Democrats is $225,000 only a few thousand dollars less than the $235,000 for Republicans.
- 88% of Republicans say they could come up with $1,000 to cover an emergency repair, compared with 86% of Democrats.
While there are differences between Republicans, Democrats and independents, such as attitudes and differential expectations around the economy (Republicans are currently more than twice as likely as Democrats to be highly confident their personal economic situation will improve in the next year), a common bond is the similarities we share as homeowners. Home emergencies and home maintenance needs do not distinguish between red or blue, and trends in home spending show our commonality.